Calculation of drip application rate (gph & in/hr)
Determining the average discharge rate
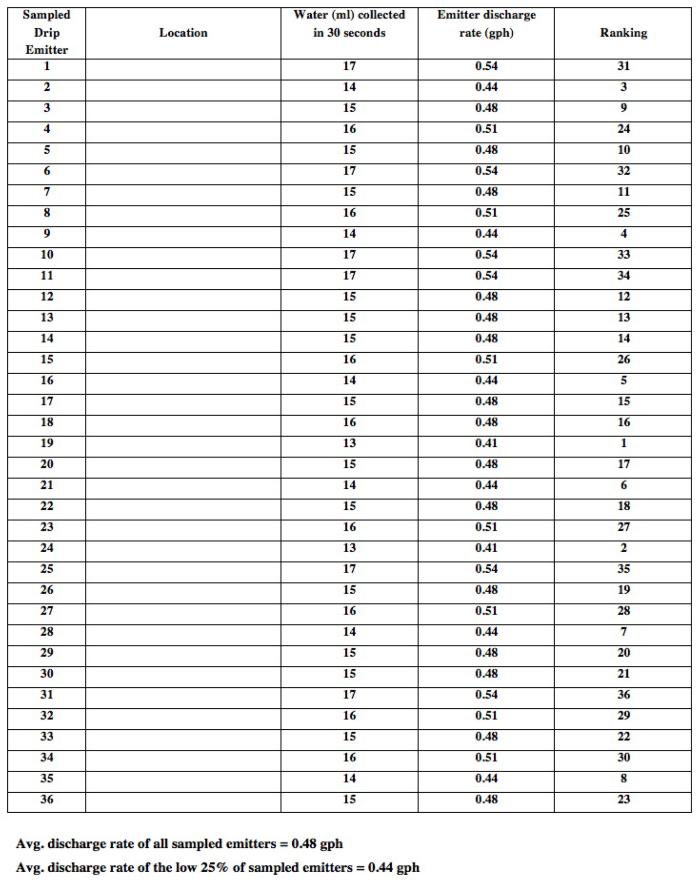
Drip emitters were sampled in a vineyard system designed with two 0.5 gph drip emitters per vine and the vines planted on a 7 foot x 11 foot spacing. Thirty-six drip emitters were sampled by measuring the water discharged from each emitter for a 30-second period. The collected data are shown in column 3 of the table below. The collected volumes were converted to emitter discharge rate (gph) and are shown in column 4 of the table.
To determine the average discharge rate, add the sampled emitter discharges rates together (column 4 of table) and divide the sum by the number of emitters sampled (36 in this case). Summing the 36 discharge rate values in column 4 of the table and dividing by 36 gives an average discharge rate of 0.48 gph.
Determining the average application rate
The emitter discharge information from the system evaluation, while valuable, must be converted to an application rate before it can be used for irrigation scheduling (that is, when and how much to irrigate).
In the example we have been using, there are two drip emitters per vine (vine spacing 7 feet x 11 feet), so the average application rate is two times the emitters’ Average Discharge Rate (i.e., 2 x 0.48 gph). The average application rate is 0.96 gph per vine.
Irrigation scheduling and plant water use
Plant water use information is most commonly provided in terms of inches of water use per day (or per week or per month). Inches of water use is difficult to use with microirrigation systems where the application rates are measured in gallons per hour.
To convert the vine water use from inches to gallons, use the following formula:
| Water use (gal/day) | = | Crop spacing (sq. ft.) | x | Water use (in/day) | x | 0.623 |
If the water use is recorded in terms of inches per week, you can use the same formula and the result would give water use in gallons per week. The same pattern holds for any other time period.
Once you have the water use expressed as gallons per plant per time period (day week, etc.), you can use the average application rate to determine how many hours you will need to irrigate. In this example, we would determine how many hours of irrigation, at a rate of 0.96 gph per vine, would be required to replace the calculated vine water use (in gallons per vine per time period).
For example, with a vine water use of 36 gallons per vine per week, 37.5 hours of irrigation time (36 gallons ÷ 0.96 gal/hr = 37.5 hours) would be required during the week to replace the 36 gallons of vine water use. Some additional hours of irrigation beyond the 37.5 hours, would be needed to compensate for irrigation inefficiencies. If you do not know your system's efficiency, adding an additional 10 to 15% to the irrigation time would be a good place to start for a well-designed system.
Determining the distribution uniformity (DU)
The distribution uniformity is defined as:
| Distribution uniformity DU - (%) |
= | Average of low quarter emitter discharge rates | ÷ | Average of all emitter discharge rates | x | 100 |
You determine the average of the low-quarter emitter discharge rates by ranking all the measured emitter discharge rates, from lowest to highest and averaging the lowest 25% of discharge rates. For example, if 40 emitters were measured, you would rank them lowest to highest, and then average the discharges of the 10 emitters with the lowest discharge rates. That would be the average of the low-quarter emitter discharge rate.
To determine distribution uniformity from the data shown in the following table you must determine (1) the average of all the emitter discharges measured (already determined above to be 0.48 gph), and (2) the average of the low-quarter discharge rate – in this case the average of the 9 (36 ÷ 4 = 9) lowest discharge rate values.
It is possible to hand rank each of the measured emitter discharge rates, from lowest to highest (results shown in column 5 of the table), but this would be very time consuming. If you are familiar with a spreadsheet program, such as MicroSoft Excel, you can use the program to perform all of the calculations and rankings easily, even with a large data set.
The average of the low-quarter emitter discharge rates for the data in the table is 0.44 gph. The average discharge rate for all of the sampled emitters was 0.48 gph, so the emission uniformity is 92%. This is a very good emission uniformity, and this drip system would be considered to be very uniform.

For more information on irrigation uniformity, click on What is an acceptable DU?
Drip system evaluation form

