Assessing Water Quality and Taking a Water Sample
The irrigation water used in microirrigation systems should be carefully evaluated to assess any potential clogging problems.
Collecting a Water Sample
Contact the laboratory that will be doing the water analysis to get guidance on collecting the sample. Often the laboratory will also provide sample bottles and any necessary additions, such as acid, for the sample.
As general guidance, when collecting a sample from a well, first allow the pump to run for at least 15 minutes (even longer is preferable). A liter or quart sample volume is usually ample for chemical constituent analyses. Make sure the sample bottle is clean and rinsed. Flush the bottle with the water to be sampled a few times prior to gathering the sample. Collect the sample as close to the well as possible but do not collect samples too close to a chemical injection point since there may be insufficient mixing. Thoroughly flush all pipes and components prior to sampling.
Surface water is more difficult to sample, and its test results can change significantly over the season. Try to take as representative a sample as possible. If suspended solids, organic matter, or both, are of concern, a liter-sized sample may not be adequate. Contact the laboratory doing the analysis for more guidance.
Deliver the sample to the lab as soon as you can. Storing the sample in a cooler or a refrigerator until it can be delivered is a good idea; keeping it in a hot pickup truck for days before taking it to the lab should be avoided since volatile and biological contaminants in a sample can change with time and high temperature may speed the process.
If the water is to be analyzed for iron, the sample must be acidified to a pH of 4 or below; otherwise, the soluble (ferrous) iron in solution will precipitate as insoluble (ferric) iron before it reaches the lab and the water analysis will show little iron in solution. Thus, two samples must be collected: one acidified sample for iron and one plain sample for the remaining constituents in solution. The laboratory can provide a sample bottle with the correct amount of acid in it for gathering the iron sample. Do not rinse the bottle prior to collecting the sample.
Water Quality Criteria
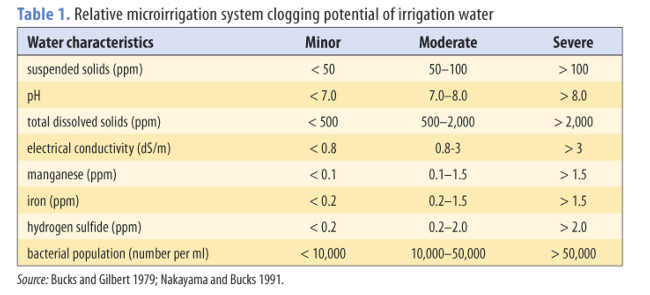
Table 1 provides criteria for assessing the potential of an irrigation to cause clogging. Other quality considerations include the following.
- Bicarbonate concentrations exceeding about 2 meq/l or 120 mg/l and pH exceeding about 7.5 can cause calcium carbonate precipitation.
- Calcium concentrations exceeding 2 to 3 meq/l can cause precipitates to form during injection of some phosphate fertilizers.
- High concentrations of sulfide ions can cause iron and manganese precipitation. Iron and manganese sulfides are highly insoluble, even in acid solutions.
- Clogging problems from iron and manganese are caused by the conversion of soluble iron and manganese to insoluble forms (for more information, see the section Preventing iron and manganese clogging). This conversion process occurs for iron if the pH exceeds about 5 and for manganese if the pH exceeds about 9.

Analyzing Irrigation Water
Irrigation water should be analyzed for the following.
- electrical conductivity (EC), a measure of the total dissolved salts (TDS); an approximate equation relating TDS (ppm) to EC (dS/m or mmhos/cm) is TDS = 640 × EC
- pH
- calcium (Ca)
- magnesium (Mg)
- sodium (Na)
- chloride (Cl)
- sulfate (SO4)
- carbonate (CO3) and bicarbonate (HCO3)
- iron (Fe)
- manganese (Mn)
Units of Concentration
The concentrations of chemicals in water are expressed on either a weight basis or a volume basis. Concentrations expressed on a weight basis are parts per million (ppm), percent concentration (%C), and milligrams per kilogram (mg/kg). Concentrations expressed on a volume basis are milligrams per liter (mg/l), milliequivalents per liter (meq/l), and millimoles of charge per liter (mmolc/l). Millimoles of charge per liter (mmolc/l) is the designated SI unit (International Standard of Units). Relationships between units are as follows:
1 ppm = 1 mg/l (for all practical purposes in dealing with dilute water solutions)
1 ppm = 1 mg/kg
1% concentration = 10,000 ppm
1% concentration = 1.33 ounce by weight per gallon of water
1 mmolc/l = 1 meq/l
Also keep in mind that 1 ppm means 1 pound of dry chemical material is dissolved in 1 million pounds of water, whereas the concentration percentage is the ratio of the weight of the dry material in the solution to the weight of the solution multiplied by 100. Grains per gallon may also be used as a concentration unit. To convert grains per gallon to mg/l, multiply the grains per gallon by 17.12.
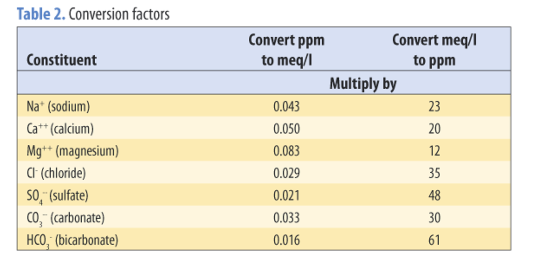
Many laboratories report concentrations of chemical constituents in a water sample as mg/l or meq/l. Sometimes converting mg/l to meq/l or vice versa is desirable. Table 2 provides useful conversion factors.


Quality of Data
The quality of the data should be evaluated using the following procedures.
- The sum of the cations (Ca, Mg, Na), expressed in milliequivalents per liter (meg/l), should about equal the sum of the anions (Cl, CO3, HCO3, SO4). If the sums are exactly equal (which is not likely if an analysis is done for each constituent), then one of the constituents was found by making sure the total of the anions and cations balanced.
- The sum of the cations and the sum of the anions each should equal about 10 times the
EC (dS/m).
If these procedures reveal poor quality data, repeat the chemical analysis.
Hardness and Alkalinity
The lab may include hardness and alkalinity values in its water analysis. These characteristics are normally not used for assessing potential clogging problems in drip irrigation, but they are more commonly used in the treatment of domestic water supplies.
The hardness of the water is primarily due to calcium and magnesium ions. Hard water tends to precipitate calcium carbonate. Thus, the higher the level of hardness (expressed in terms of calcium carbonate), the greater the potential for calcium carbonate precipitation in a drip irrigation system. The classifications of hardness are
0–75 mg/l = soft
75–150 mg/l = moderately hard
150–300 mg/l = hard
more than 300 mg/l = very hard
Alkalinity of water is a measure of its ability to neutralize acids. Alkalinity is caused mostly by carbonate and bicarbonate ions. To reduce the pH of water that is highly alkaline, you need to add more acid than you do for water that is less alkaline. A water is classified as alkaline if its pH exceeds 7.
Guidelines
The following steps will help you evaluate water quality; refer to table 1 for assistance.
- What is the total dissolved solids concentration? If only the electrical conductivity is given, multiply the EC (mmhos/cm) by 640 to determine the total dissolved solids.
- What is the calcium concentration? If the calcium concentration exceeds 2 to 3 meq/l, see the section Preventing Calcium Carbonate (lime) clogging.
- What is the bicarbonate concentration? If the bicarbonate concentration exceeds about 2 meq/l, see the section Preventing Calcium Carbonate (lime) clogging.
- What are the iron and manganese concentrations? If either concentration exceeds about 0.2 ppm, see the section, Preventing Iron and Manganese Clogging.
Examples
Table 3 gives water quality data from the analysis of two irrigation water samples. The water quality criteria from Table 1 are used to evaluate the clogging potential of the two waters.
- Water 1. This is a gypsiferous water because of the large amounts of SO4, Ca, and Mg. The sum of the cations equals 28.9; the sum of the anions equals 28.7, and the ratio of the sum of the cations to EC equals 11.5. All in all, the quality indicated by these data is good. The relatively high total dissolved salts, or TDS, (1,900 ppm) indicates that the water has some clogging potential. This is verified by the relatively high bicarbonate concentration (5.2 meq/l), compared with the standard of 2 meq/l. The calcium and bicarbonate concentrations together suggest that calcium carbonate could clog the emitters, particularly if the pH were to rise as a result of any chemical injection. The iron and manganese concentrations indicate little potential for clogging from precipitation of those elements.
- Water 2. Two separate samples were collected. Acid was added to one of the samples to prevent the Fe and Mn from oxidizing and precipitating out. Both the sum of the cations and the sum of the anions equals 8.7, indicating the differences were used to determine the concentration of one of the constituents (usually SO4). The ratio of the sum of the cations to the EC equals 10, suggesting good-quality data. The analysis reveals little potential for clogging from total dissolved salts (560 ppm), but the pH and the HCO3 concentration indicate that clogging might result from calcium carbonate precipitation. The levels of Mn and Fe indicate a severe potential for clogging from manganese and iron precipitation. However, little manganese precipitation should occur unless the pH exceeds 9. Care should be taken when injecting fertilizers or amendments that contain calcium into this water.
Table 3. Water quality analysis of two irrigation water samples
| Constituent | Water 1 | Water 2 |
|---|---|---|
| EC (dS/m) | 2.51 | 0.87 |
| TDS (ppm) | 1,900 | 560 |
| pH | 7.4 | 7.7 |
| Ca (meq/l) | 13.3 | 1.9 |
| Mg (meq/l) | 10.2 | 1.3 |
| Na (meq/l) | 5.4 | 5.5 |
| Cl (meq/l) | 4.5 | 2.0 |
| HCO3/CO3 (meq/l) | 5.2 | 2.0 |
| SO4 (meq/l) | 19 | 4.7 |
| Mn (ppm) | <0.1 | 2.6 |
| Fe (ppm) | <0.1 | 0.65 |
References
Barnes, D., and F. Wilson. 1983. Chemistry and unit operations in water treatment. London and New York: Applied Science Publishers.
Bucks, D. A., F. S. Nakayama, and R. G. Gilbert. 1979. Trickle irrigation water quality and preventive maintenance. Agricultural Water Management 2:149–62.
Nakayama, F. S., and D. A. Bucks. 1991. Water quality in drip/trickle irrigation: A review. Irrigation Science 12:187–92.
Nordell, E. 1961. Water treatment for industrial and other uses. New York: Reinhold.
Sawyer, C. N., and P. L. McCarty. 1967. Chemistry for sanitary engineers. New York:
McGraw-Hill.
